
Contents
SYD vs SATS Financial Performance & Investment Analysis
The primary goal of an entity is to maximize the worth of shareholders by taking innovative and value-added strategies. This report will help to understand profitability and investment performance over the recent five periods of Sydney Airport Limited (SYD) and Singapore Airport Terminal Services Limited (SATS). Furthermore, the changes in the capital structure over the last five years are also evaluated for improving knowledge about the factors affecting changes in the capital structure. The cost of capital and cost of debt is determined for assessing the weighted average cost of capital over the recent period. The valuation of common stock of both the companies is to be performed for finding the most suitable investment opportunity by selecting either entity. Get assistance in calculations of different ratios from our accounting assignment help experts in Singapore.
Profitability Performance Ratios Calculations
Operating Profit Ratio
This ratio is efficient to assess overall core earnings from main business activities supporting the growth of an entity in the future. This ratio provides the availability of funding for covering finance and administrative expenses for supporting overall profitability status (Ojugo, 2009).
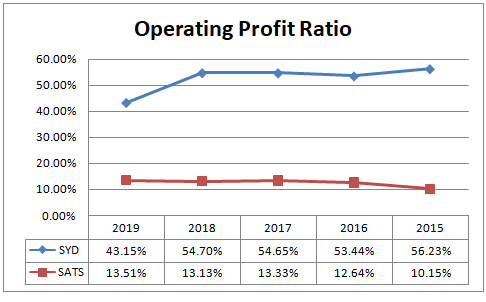
SYD has an operating profit ratio of 43.15% in 2019 and 56.23% in 2015 reflects a downfall trend over the recent five years due to downfall in the operating earnings over the considered period. The improvement in the operating expenses over the recent periods contributes to a downfall in the operating earnings (SYD, 2019). SATS has a ratio of 13.51% in 2019 and 10.15% in 2015 presenting an improvement in operating earnings over the periods. The improvement in the revenue against effective control over the operating expenses results in an improvement in operating earnings (SATS, 2019). Overall, SYD has higher operating earnings performance than that of SATS over the considered periods.
Net Profit Ratio
This ratio is extremely important for all stakeholders as it can affect the decision behavior of stakeholders. Investors assess overall return performance that can help to estimate the return on investment in the equity of an entity (Parrino et al., 2011).
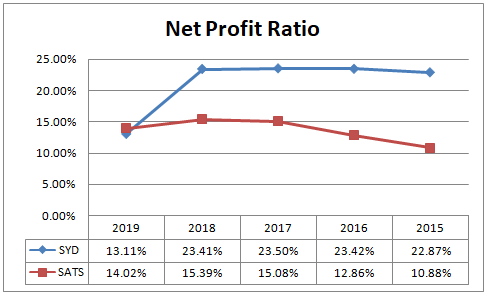
SYD has a ratio of 13.11% in 2019, which is much lower than 22.87% in 2015 presenting a downfall trend in the net profitability performance over the considered periods. The company has reduced its net earnings because of improved expenses over the periods against improved revenue. SATS has a net ratio of 14.02% in 2019 against 10.88% in 2015 that presents an improving trend in the net earnings performance over recent periods. It reflects an effective control over the expenses for improving overall net profit performance over the considered periods (SATS, 2019). Overall, SATS has higher net profitability performance than SYD over the recent periods.

Financial Performance Analysis!!
 Best Accounting Experts in Singapore
Quality Analysis at Affordable Prices
Plagiarism and AI Free Assistance
Return on Equity
This ratio is important for equity investors to estimate the expected return on their investment in an entity. The high return on equity reflects the attraction of potential investors to expand the growth of the entity (Gibson, 2008).
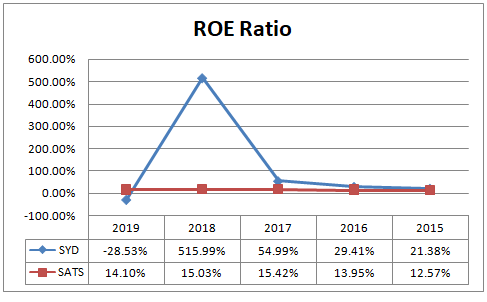
Return on equity in the case of SYD has a high fluctuated trend because of a significant change in an equity fund in the business. SYD has a negative balance in equity due to losses in 2019 that indicates the downfall in the return on equity in recent periods. SATS has an increasing trend in the return on equity over recent periods because of improvement in the net earnings. The return performance to shareholders is constant and reliable in the case of SATS while SYD has a high risk to estimate the reliable return on shareholders over the considered periods (SYD, 2019).
Return on Assets
ROA indicates overall return performance with the use of investment in the assets of an entity. This ratio indicates the growth aspect with the information about the efficiency of using the investment fund in the acquisition of total assets (Gibson, 2008).
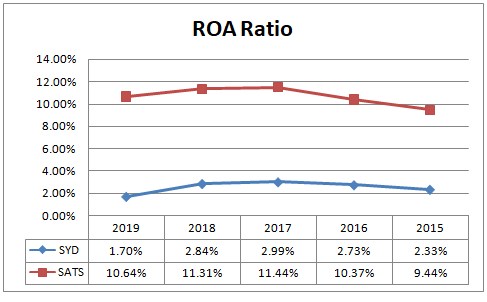
SYD has a ROA return of 1.70% in 2019 while 2.33% in 2015 that presents a downfall in the earnings with the use of investment in the assets over the recent periods. The downfall in the net earnings results in the change in the return on assets over the recent periods. SATS has a downfall trend in the return on assets because of improvement in the investment of the assets over recent periods (SATS, 2019). Overall, the return on assets performance of SATS is higher than that of SYD.
Investment Performance Ratios Calculations
Price-Earnings Ratio
P/E ratio is important for assessing market performance because it can compare earnings against market price for seeing the impact of earnings of the market price (Charifzadeh & Taschner, 2017).
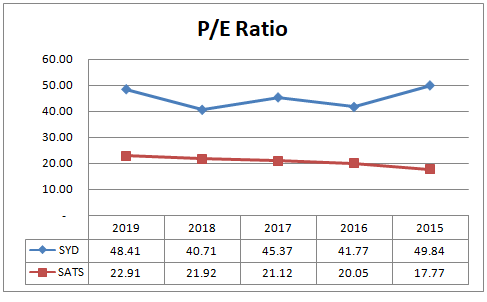
SYD has an upward movement in the price-earnings ratio over the recent five periods because of high improvement in the market price with a downfall in the earnings over the periods. SATS has an improving trend in the ratio with the increase in the market price along with improvement in the earnings over recent periods. Overall, the market performance of SYD is better than that of SATS over recent periods.
Financial Performance Analysis!!
Best Accounting Experts in Singapore
Quality Analysis at Affordable Prices
Plagiarism and AI Free Assistance
Dividend Yield Ratio
This ratio assesses the impact of dividends on the market price of a common share of an entity for seeing the importance of dividends to affect the market price (Gibson, 2008).
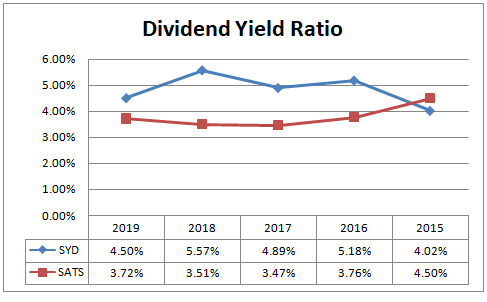
SYD has a ratio of 4.50% in 2019 while the same is 4.02% in 2015 presenting an improvement in the dividend yield performance with improvement in the market price against dividend payment (SYD, 2019). SATS has a ratio of 3.72% in 2019 while the ratio is 4.50% in 2015 assessing a downfall in the dividend yield performance over the periods. Overall, the market performance of SYD is higher than that of SATS.
Capital Structure
| Capital Structure: SYD | 2019 | 2018 | 2017 | 2016 | 2015 |
| Equity | -5.97% | 0.55% | 5.44% | 9.29% | 10.91% |
| Debt | 105.97% | 99.45% | 94.56% | 90.71% | 89.09% |
The capital structure of SYD reflects a significant change in the debt funding against equity funding as the debt funding has a strong improvement over recent periods against downfall in the equity funding. The improvement in the debt funding over the recent periods results in the improvement in the solvency risk of the company (SYD, 2019).
| Capital Structure: SATS | 2019 | 2018 | 2017 | 2016 | 2015 |
| Equity | 75.45% | 75.23% | 74.19% | 74.33% | 75.13% |
| Debt | 24.55% | 24.77% | 25.81% | 25.67% | 24.87% |
The capital structure of SATS presents a higher portion of equity against the lower portion of the debt in the development of the total capital structure. Over recent periods, the decline in the debt funding against equity funding can be estimated with the capital structure of SATS. The solvency risk of SATS has a low level with the higher control of owners against a low control over outsiders on the assets of the company.
Both companies are different in capital structures because of their nature as SYD has a high-risk company with an improvement in the debt funding while SATS has a low solvency risk due to low debt funding against high equity funding. SATS can access easily equity financing because of reliable return performance and low solvency risk while SYD has difficulty accessing equity investment due to high solvency risk and high fluctuated return on equity (Ainsworth & Deines, 2019).
Cost of Equity and Debt
| Cost of Equity of SYD | |
| Daily Average Return | -0.0638% |
| Yearly Return | -20.79% |
As the cost of equity is in negative that means unrealistic return so this cost of equity is determined with the assistance of CAPM (Capital Asset Pricing Model) that considers beta as a risk factor and needs market risk premium accordingly for estimating required rate of return (Cuthbertson & Nitzsche, 2006).
Risk free return = 0.85%
Beta = 0.73 (Yahoo Finance, 2020).
Market Risk Premium = 6.5%
Cost of Equity = 0.85%+6.50%×0.73 = 5.60%
Cost of debt = 3.12%×(1-30%) = 2.18%
| Cost of Equity of SATS | |
| Daily Average | -0.2209% |
| Yearly Return | -55.39% |
As the cost of equity is negative that means unrealistic return so this cost of equity is determined with the assistance of CAPM (Capital Asset Pricing Model) that considers beta as a risk factor.
Risk free return = 0.83%
Beta = 0.71 (Yahoo Finance, 2020).
Market Risk Premium = 6.5%
Cost of Equity = 0.83%+6.50%×0.71 = 5.45%
Cost of debt = 3.11%×(1-17%) = 2.58%
WACC
The weighted average cost of capital reflects the contribution of the cost of each source in their proportion for finding the most suitable required rate of return on investment in an investment. The formula for calculation of WACC is given below:
WACC = Cost of debt × Debt weight + Cost equity × Equity weight
| SYD | SATS | |
| Cost of Equity | 5.60% | 5.45% |
| Cost of Debt | 2.18% | 2.58% |
| Weight of Equity | -5.97% | 75.45% |
| Weight of Debt | 105.97% | 24.55% |
| WACC | 1.98% | 4.74% |
Valuation of Common Share
Financial Performance Analysis!!
Best Accounting Experts in Singapore
Quality Analysis at Affordable Prices
Plagiarism and AI Free Assistance
Constant Growth Dividend Discount method can be used for assessing the intrinsic value of common stock with the use of the following formula (Brigham & Houston, 2012):
Value = D1/r-g
Where
D1 = expected dividend
g = growth rate
r = required return
| SYD | SATS | |
| Existing Dividend | $0.39 | $0.19 |
| Growth rate | 1.50% | 1.50% |
| Expected dividend | $0.40 | $0.19 |
| r | 5.60% | 5.45% |
| Value of Common Share | $9.67 | $4.89 |
Conclusion and Recommendation
The actual market price of a common share of SYD is $8.66 while the intrinsic value is $9.67 that presents improvement in the market price in the future. The market price of a common share of SATS is $5.11 while the intrinsic value is $4.89 that presents a reduction in the market price in the future. However, the high solvency risk and low return performance of SYD indicates acceptance of SATS is valuable for getting a reliable return on investment. Therefore, it is highly recommend
