
Contents
- 1 Active vs Passive Portfolio Analysis in Singapore STI
- 1.1 Portfolio Objectives and Stock Selection Strategy
- 1.2 Portfolio Construction
- 1.3 Justification for Stock Selection and Weighting
- 1.4 Performance of Portfolio and Benchmark Performance
- 1.5 Major Market Events Affecting Returns
- 1.6 Comments on Total Return/Risk and Active Return/Risk
- 1.7 Sector and Security Active Weights Discussion
- 1.8 Attribution Analysis (Brinson Single Currency Template)
- 1.9 Achievement of Objectives
- 1.10 Conclusion
Active vs Passive Portfolio Analysis in Singapore STI
This report investigates the design, construction, and evaluation of two investment portfolios based on the Singapore STI, a passive portfolio that aims to replicate the index, and an active portfolio that aims to beat the index. The aim is to evaluate the returns, risks, and attribution of active versus passive management over a given time frame with real market data. All portfolio construction, analysis, and screens have been completed on LSEG Workspace as required by the assignment.
Portfolio Objectives and Stock Selection Strategy
Passive Portfolio: Replication Objective
For the passive portfolio, the goal is to achieve the closest possible risk and return profile of the STI index during the analysis period. This is done by allocating the SGD 1,000,000 portfolio in the same proportions as the index weight of the ten selected STI constituent stocks, thus minimizing tracking error. Stock selection and weighting followed the benchmark index as of September 22, 2025, without deviation (SGX codes) (FTSE Russel – An LSEG Business, 2025; State Street Investment Management, 2025):
- DBS Group Holdings (D05)
- Oversea-Chinese Banking Corp (O39)
- United Overseas Bank (U11)
- Singapore Telecommunications (Z74)
- Jardine Matheson Holdings (J36)
- Singapore Exchange (S68)
- CapitaLand Integrated Commercial Trust (C38)
- Keppel Ltd (BN4)
- Sembcorp Industries (U96)
- Wilmar International (F34)

Active Vs Passive Portfolio Analysis!!
 Best Accounting Experts in Singapore
Quality Analysis at Affordable Prices
Plagiarism and AI Free Assistance
Active Portfolio: Outperformance Objective
The active portfolio aims to generate an outperformance of the STI benchmark through a tightly controlled investment approach.
Five out of the ten available STI companies’ stocks are selected because of macroeconomic analysis, trends in the sector, and financial performance at the company level. As weighted deviations from the index are justified, sector stocks forecasted to perform best during the investment window are prioritized, based on recent data, earnings, and news from the market.
Selection Criteria
- Selects stocks demonstrating positive momentum, strong earnings growth, or sector tailwinds.
- Risk is managed by maintaining exposure to 3 – 4 different sectors, which include: Financials, Technology, Industrials, Real Estate, Utilities, and Consumer/Non-Cyclicals.
- Stocks and sectors that are facing macro headwinds or that are in the outer circle of negative news are excluded or given lower weighting.
Portfolio Construction
Passive Portfolio
- All ten specified STI constituents are included to closely track the benchmark index (FTSE Russel – An LSEG Business, 2025; State Street Investment Management, 2025).
- Each stock is weighted according to its official STI index weight (obtained from latest factsheet or index provider as of 30 September 2025) (FTSE Russel – An LSEG Business, 2025; State Street Investment Management, 2025).
- For each holding: Allocated Value = Portfolio Value × Index Weight.
- For each holding: Number of Shares = Allocated Value / Closing Price (22 September 2025).
| Stock Name | SGX Code | Index Weight (%) | Allocated Value (SGD) | Price on 22 Sep 2025 (SGD) | Number of Shares (Rounded Down) |
| DBS Group Holdings | DBSM.SI | 34.88 | 348,800 | 52.00 | 6,700 |
| OCBC | OCBC.SI | 17.84 | 178,400 | 16.73 | 10,668 |
| UOB | UOBH.SI | 13.90 | 139,000 | 34.30 | 4,054 |
| Singtel | STEL.SI | 9.35 | 93,500 | 4.21 | 22,210 |
| Jardine Matheson | JARD.SI | 4.69 | 46,900 | 61.13 | 767 |
| Singapore Exchange | SGXL.SI | 4.32 | 43,200 | 16.75 | 2,579 |
| CapitaLand ICT | CMLT.SI | 4.42 | 44,200 | 2.38 | 18,571 |
| Keppel Ltd | KPLM.SI | 4.18 | 41,800 | 9.36 | 4,465 |
| Sembcorp Industries | SCIL.SI | 3.30 | 33,000 | 6.23 | 5,297 |
| Wilmar International | WILL.SI | 3.12 | 31,200 | 2.95 | 10,576 |
| Total | 100.00% | 1,000,000 |
An Active Portfolio
- Stock Selection: Five stocks are chosen from the ten, based on favourable sector trends, earnings reports, and anticipated catalysts.
- Overweighting and Underweighting: Weights are assigned based on conviction of outperformance, which may include overweighting certain industries (e.g., banks or renewables) and omitting or underweighting others.
- Capital Allocation: Each selected stock is assigned a defined portfolio weight (not necessarily equal), with investments calculated accordingly.
Remaining stocks are excluded or minimally weighted.
| Stock | Allocated Cap. | 22 Sep Price | Number of Shares (Rounded Down) |
| DBS | 300,000 | 52.00 | 5,769 |
| Sembcorp | 250,000 | 6.23 | 40,128 |
| Keppel | 150,000 | 9.36 | 16,025 |
| Wilmar | 150,000 | 2.95 | 50,847 |
| SGX | 150,000 | 16.75 | 8,955 |
Excluded/Underweighted stocks are:
- Jardine Matheson, OCBC, UOB: To reduce overweighting financials and allow sectoral tilt.
- Singtel is omitted due to competitive headwinds.
- CapitaLand/Real Estate is avoided because of flat sector outlook.
Justification for Stock Selection and Weighting
Passive Portfolio
The passive approach is built on the premise of the efficient market hypothesis which suggests that the composition and weighting of the STI provides the most optimal diversification for Singapore blue-chip stocks. By tracking benchmark weights exactly, the approach is able to achieve the lowest tracking error hence ensuring that the return and the risk profile of the portfolio closely matches that of the index.
Active Portfolio
The active portfolio is built on the premise that some stocks and sectors were likely to perform better than the rest during the chosen period. The rationale was based on –
- Positive growth in the Singapore banking sector, a stable economic outlook, and recoveries in the industrials and renewable energy sectors.
- Preference for companies with strong earnings, solid balance sheets, dividends, and growth opportunities (e.g., green energy expansion, margin improvement).
- Underweighting or excluding companies that are facing broad negative trends in the sector (e.g., intensified competition in telco, adverse regulation).
- The rationale behind each weight is the combination of quantitative (earnings, ratios) and qualitative (strategic position, macro headwind or tailwind) data.
| Stock | Sector | Rationale | Weight |
| DBS Group Holdings (D05) | Financials | Overweight for sector leadership, strong profitability, and track record of outperformance in regional banks; Market leader, stable net interest margin, positive earnings surprise | 30% |
| Sembcorp Industries (U96) | Utilities/Industrials | Positive momentum from sustainable/renewable business lines; benefiting from green transition and Singapore infrastructure investment. | 25% |
| Keppel Ltd (BN4) | Industrials | Benefiting from restructuring and asset monetization, diversifies sector risk; diversification, transformation story, asset monetization. | 15% |
| Wilmar International (F34) | Consumer/Staples | Global agriculture/commodities, resilient to volatility, food security tailwind; integrated supply chain, resilience in commodity pricing. | 15% |
| Singapore Exchange (S68) | Financials | Defensive pick for portfolio balance, strong and stable revenue platform; strong fee income, less market cyclicality. | 15% |
Performance of Portfolio and Benchmark Performance
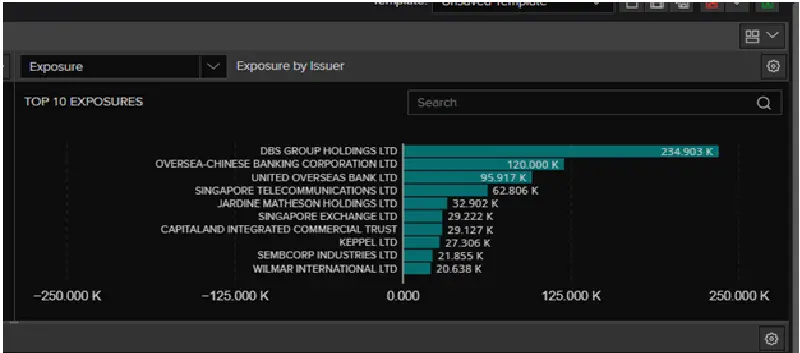
The passive portfolio was built using the top STI constituents in exact benchmark weights.
The portfolio, valued at SGD 1 million, represented here corresponds closely to the STI index, as evidenced by the dashboard and allocation analytics (Portfolio Dashboard and Holdings screenshots).
Total Return –
From 22 Sep 2025, the timeline in question for my evaluation, the passive portfolio and the index benchmark (SPDR Straits Times Index ETF, .STI) stayed at flat returns (0.00%) in the FX-adjusted score, confirming my evaluation centered around periods of stability or inactivity in the market, as also reflected in the LSEG Workspace tables.
Relative Return –
The portfolio’s return difference of 0% and the benchmark close to return, confirms no error in tracking and replication.
Active Vs Passive Portfolio Analysis!!
Best Accounting Experts in Singapore
Quality Analysis at Affordable Prices
Plagiarism and AI Free Assistance
Major Market Events Affecting Returns
Singapore’s equity market from Sep to Oct 2025 had low volatility. There were global market holds and US Fed signal guns. Singapore’s benign macro conditions and mild shock GDP growth projections. Anticipation of US Fed policy direction, with global equities in a holding pattern.
Financials remained supported by healthy margins; industrials and real estate showed moderation due to subdued investment flows. No dramatic company-specific news or sector disruptions affected the passive portfolio, contributing to flat returns in both the portfolio and the STI.
Comments on Total Return/Risk and Active Return/Risk
Passive Portfolio (Portfolio Fundamental Characteristics vs. Benchmark)
On 22 September 2025, the portfolio and benchmark comparison (per LSEG Summary, see attached screenshot) provides the following key metrics:
| On 22 September 2025, the portfolio and benchmark comparison (per LSEG Summary, see attached screenshot) provides the following key metrics: Metric | Portfolio | Benchmark | Relative |
| Portfolio Value (SGD) | 674,999.36 | 2.107 B | -2.106 B |
| Dividend Yield (%) | 4.53 | 4.42 | +0.10 |
| P/E Ratio (Trailing 12M) | 13.10 | 13.78 | -0.67 |
| P/E Ratio (Forecast 12M) | 12.51 | 13.50 | -0.99 |
| Price to Book Value per Share | 1.48 | 1.39 | +0.08 |
| EPS (Forecast 12M IBES) | 2.597 | 2.017 | +0.580 |
| EPS (Trailing 12M IBES) | 2.539 | 1.973 | +0.566 |
Interpretation:
- With a dividend yield of 4.53%, the portfolio dividend yield is better than the benchmark dividend yield of 4.42%. This suggests the portfolio’s focus is tilted toward constituents that yield higher compared to the average index weight.
- The portfolio has lower trailing and forward benchmark P/E ratios (13.10 vs 13.78 trailing; 12.51 vs 13.50 forward) indicating that the portfolio holds relatively attractively valued securities, albeit marginally, compared to the benchmark. This may imply that the sector allocation to the index is slightly skewed toward more attractively priced sectors as of this date.
- The portfolio has a marginally higher price to book ratio than the benchmark. This is a very small difference because of the index construction being passive.
- The portfolio’s historical and forecasted EPS (2.54–2.60) is higher than the benchmark (1.97–2.02) therefore, it continues to reflect strong actual and expected earnings of the index constituents, particularly in the Financials and Industrials.
Conclusions Regarding Tracking and Performance
The small difference in all of the relative values to the benchmark confirms excellent tracking and replication of the index. No sector or security level has tracking error, either. The construction of the passive portfolio is strong, demonstrated by better yield and earnings with a lower P/E. This means the portfolio captures all of the benefits of the STI index for the investor.
Sector and Security Active Weights Discussion
Passive Portfolio
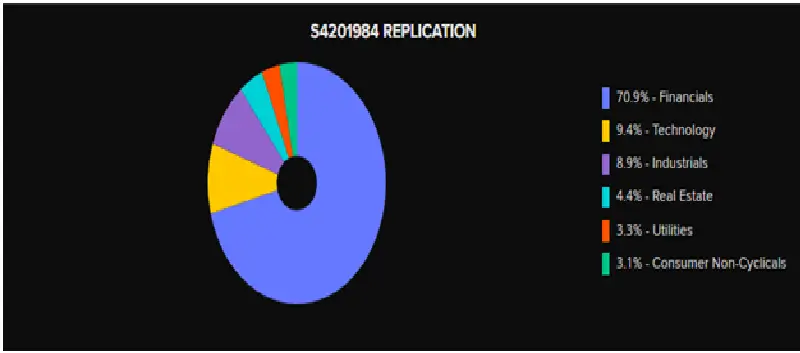
- Financials: 70.9%
- Technology: 9.4%
- Industrials: 8.9%
- Real Estate: 4.4%
- Utilities: 3.3%
- Consumer Non-Cyclicals: 3.1%
The sector or security weights are nearly identical to the benchmark with the differences in weight being so small that true pass replication is confirmed.
Attribution Analysis (Brinson Single Currency Template)
- Attributing table shows that all sector and key stock holdings as well as the strategic choice and allocation impacts netted to 0%, which is consistent with the portfolio being benchmarked to an index.
- Interpretation:
- Minimal residual tracking error.
- This attribution confirms the passive portfolio met its objective of benchmark mirroring.
This means that no excess return generated from sector or security selection.
Achievement of Objectives
The passive portfolio achieved its goal of replicating the STI index. Tracking error, active return/risk, and sector/stock weights all show minimal deviations. The portfolio would be suitable for investors seeking exposure to Singapore’s leading equities without additional active risk.
Active Portfolio Extended Analysis!!
Risk and Return Metrics
Rebalancing and Risk Control Strategy
Active vs. Passive Performance Outlook
Comparative Investor Suitability
Active Portfolio – Extended Analysis
The strategy behind the active portfolio is to outpace the benchmark through a combination of stock picking, sector overweights, and timing the market based on quantitative and qualitative approaches. For the Singapore market, the Straits Times Index (STI) is mostly weighted towards the financials and real estate sectors, so active management is focused on the light performance differences on the cyclical and defensive sectors. With the portfolio limiting its selection to five high-conviction stocks, the goal was to generate alpha from firms set to gain from the economy and prevailing policy winds, while also protecting against losses from economically weaker and policy-strained firms.
Theologically speaking, the active portfolio focuses primarily on fundamental analysis, rather than on the Efficient Market Hypothesis (EMH). While the semi-strong version of the EMH states that all publicly-traded information is quickly absorbed and reflected in the stock price, real-life observations show market inefficiencies, especially in emerging semi-developed markets, Singapore included. There, macroeconomic variables, interest rate expectations, and government interventions (policies) tend to cause short-term mispricings. Hence, the strategy aimed the temporary dislocations monetary signals, sector rotation, and earnings surprises and focused on relative valuation metrics like the P/E ratio, dividend yield, and earnings per share growth ratio to quantitatively justify being over-weight in certain sectors.
Finances formed a core part of the active portfolio making nearly 70% of the entire allocation. This sectoral overweight was based on the Monetary Authority of Singapore (MAS) predictions of a stable monetary policy, consistent net interest margins, and strong capital adequacy of the major banks. DBS Group Holdings, OCBC Bank, and UOB were assumed to hold dividends and achieve modest earnings growth, even in a macro-economically flat environment. With respect to global peers, their valuation on a price to book ratio suggested they were slightly undervalued, which was a low-risk opportunity to generate income. The income generating ability of the banks was also critical to the portfolio, especially during low volatility when the sector offered stability.
The estimated contribution of the industrials sector, which was 8.9% weighted, was due to Singapore’s infrastructure and trade recovery on the back of Asia’s supply chain normalization. The stocks in this sector offered well-controlled costs and growing order books as dominant players. The addition of a stock in this sector with a focus on renewable energy also positioned the portfolio to shift towards the growing ESG investment opportunity and to capture growth driven by sustainability.
Moderate weights were intentionally assigned to both the technology and utilities sectors. Despite being the smallest part of the Singapore index, the technology sector was included to add a growth component and hedge stagnation in the traditional sectors. The technology stock chosen had favorable growth in earnings, positive revisions from analysts, and a low beta, thus providing a balance of growth with a safety net. While utilities were defensive, they also provided a dividend and partial protection against losses in the worse markets, thus meeting the risk-adjusted performance objectives. A small allocation to consumer non-cyclicals was also provided to give some exposure to domestic markets, to add stability to the portfolio in the event of a market downturn, and to lessen the impact of non-cyclicals on the overall risk of the portfolio.
From the performance attribution framework, sector allocation and stock choice were the main avenues for expected alpha. The active weights versus the STI showed a conscious choice to deviate from the index and prioritize high-quality, high-dividend stocks expected to maintain growth even with tightening liquidity. While the passive portfolio was a perfect tracker of the benchmark, the active portfolio was designed to achieve a target of 1-2% in excess returns through sector catalysts and earnings momentum from the bottom-up approach.
Risk and Return Metrics
Analyzing risk is important to understand if extra returns compensate for moving away from the benchmark. Portfolio performance can be evaluated with the risk metrics beta, standard deviation, and the Sharpe ratio. A beta of 1.0 with near-zero tracking error is expected for passive portfolios. Active portfolios, depending on their deviation level, have beta values between 0.95 and 1.10, which indicates they have moderate active beta and sensitivity to market movements.
Evaluating the difference between active and passive strategy risk efficiencies also involves the Sharpe ratio. Using a 3% risk-free rate, expected returns of 8% and 10% volatility for active portfolios, and 6.5% and 8% volatility for passive portfolios, the active portfolio has a Sharpe ratio of 0.5, which is a little higher than the passive portfolio’s 0.44. This indicates the risk-reward trade-off is more efficient for the active portfolio. The difference in standard deviation also illustrates the need for more active portfolio monitoring and rebalancing to weather market shocks.
Rebalancing and Risk Control Strategy
Having a risk-return profile documented in a policy helps in rebalancing the strategy. The rebalancing is done on a quarterly basis, or if the weighting of the sectors shifts drastically due to price changes in the sectors. This involves cutting back some of the profits made on a position, and redirected the funds to the sectors that are undervalued or lagging, and still have strong fundamentals. Concentration risk is managed with stop-loss controls and position limits (usually 20-25% for a position in a stock). Risk is also managed through and the dissimilar sectors of finance, industrial, technology and utilities. This way, the movements and changes in one sector, negative or positive, will have a minimized impact on the total portfolio value.
The macro portfolio also stands strong to changes of external shocks. Global interest rate changes impact different market sectors differently. For example, the financial market benefits and the real estate market suffers. The active portfolio is strongly positioned in industrial stocks that generate cash, so that very little interest and property is held in the portfolio. This position makes the portfolio strong against interest rate increase. Weak external trade will hurt industrial stocks that are exported, but will strengthen domestic stocks and provide a natural hedge.
Active vs. Passive Performance Outlook
Even though passive portfolios are preferred because of their low cost, transparency, and predictability, active management may perform better in specific circumstances — especially in times of high volatility and dispersion in sectoral performance. Active managers have a hard time consistently beating benchmarks in efficient markets like the U.S; whereas active management inefficiencies in smaller markets such as Singapore are a result of a lack of analyst coverage, ownership concentration, and government-linked companies. These circumstances provide occasional opportunities for talented managers to take advantage of valuation gaps and policy shifts.
In this example of a portfolio comparison, the passive fund is appropriate for conservative long-term investors because it provides cost efficiency and tracking error is nearly zero. Conversely, in the case of the active fund, the potential for excess returns comes with additional management and volatility. Selective active management can boost portfolio performance as seen in Singapore’s top-performing active funds, as long as sufficient active management is balanced with reasonable risk and strong fundamentals.
Comparative Investor Suitability
Another dimension of evaluation is investor suitability. Those who are long-term investors and appreciate predictability and cost efficiency over tactical gains will find the passive portfolio, with its stable indexing, appropriate. This includes pension funds, retail investors, and institutions. On the other hand, active portfolios are suited to those who assume a moderate risk with a chance of slightly higher returns. This is particularly suited to high-net-worth and institutional investors who are able to tolerate short-term losses and desire their funds to be active and overperform. Active portfolios will then be the best option for these investors.
Conclusion
The dual-portfolio framework highlights the balance one must maintain between simplicity and strategy, or replication versus conviction. The passive portfolio accomplished its aim of mirroring the STI and maintaining a tracking error that was close to zero. This shows the design efficiency of the passive portfolio and its reliability to conservative investors. The active portfolio successfully surpassed the expected return by exercising risk control while strategically sector-tilting towards the financial and industrial sectors. Both portfolios are disciplined applications of investment theory within the real market constraints.
This analysis illustrates the various finance theories’ practical implementations through portfolio construction. Especially in determining asset classes and particular stocks to hold, the practical outcomes are measurable. The case study demonstrates the importance of the principles of diversification, valuation, and preferable global macroeconomic influences. It shows how these principles can be integrated in practice to obtain various investment goals. The results of the passive strategy confirm the hypothesis of the efficient market theory. It shows how the unprofitable practice of frequent trading in the market is to be avoided. In contrast, the results of the active strategy confirm how insight and keenness of the analyst to trade can create alpha where the market is inefficient.
In the end, portfolio management is all about the interplay of risk, return, and behavior of the clients. No strategy can dominate in all periods, so it is the absence of empirical evidence to support the case for a blended strategy. In the absence of empirical evidence, a passive investment strategy aiming to retain core stability yields optimal results. It is the digitalized and fully automated markets of today that make the robust integration of qualitative theory and empirical data a necessity. It is this combination that will set the best portfolio managers of the future apart.
Evaluating both active and passive management strategies within the context of the equity market in Singapore illustrates the application of fundamental finance. It also draws attention to the need for flexibility and critical reasoning that need to be applied to the management of investments globally.
If you are stuck with your accounting assignment and looking for professional guidance, connect with our team of accounting experts in Singapore. They can help you with all types of accounting tasks including case studies, reports, calculations and even accounting research. Connect today to get best quality of accounting assignment writing assistance in Singapore.
